Everyone who has spent time debugging errors in code that has multiple threads knows the pain of pressing F10 and seeing the cursor jump to a completely different part of the system (that is, everyone who has ever tried to).
There are a few tools in VS2017 that make this process slightly easier; and this post attempts to provide a brief summary. Obviously the examples in this post are massively contrived.
Errors
Let’s start with an error occurring inside a parallel loop. Here’s some code that will cause the error:
static void Main(string[] args)
{
    Console.WriteLine("Hello World!");

    Parallel.For(1, 10, (i) => RunProcess(i));

    Console.ReadLine();
}

static void RunProcess(int i)
{
    Task.Delay(500).GetAwaiter().GetResult();

    Console.WriteLine($"Running {i}");

    if (i == 3) throw new Exception("error");
}
For some reason, I get an error when a few of these threads have started. I need a tool that tells me some details about the local variables in the threads specifically. Enter the Parallel Watch Window:
[caption id=“attachment_2513” align=“alignnone” width=“600”]
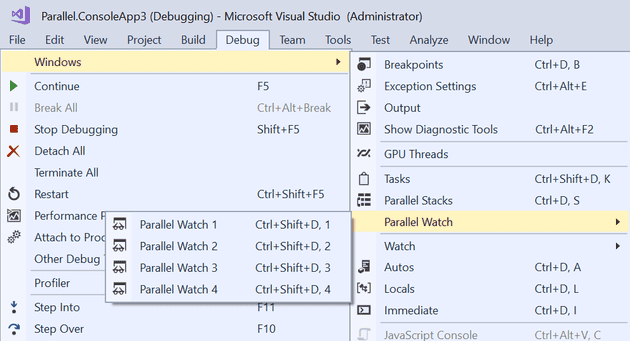 Figure 1 - Launch Parallel Watch Window[/caption]
This gives me a familiar interface, and tells me which thread I’m currently on:
[caption id=“attachment_2512” align=“alignnone” width=“600”]
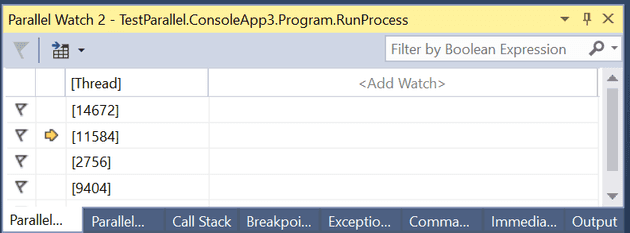 Figure 2 - Parallel Watch Window[/caption]
However, what I really want to see is the data local to the thread; what if I put “i” in the “Add Watch” cell:
[caption id=“attachment_2511” align=“alignnone” width=“600”]
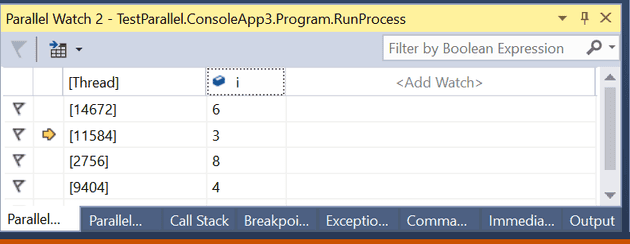 Figure 3 - Add a watch[/caption]
As you can see, I have a horizontal list of watch expressions, so I can monitor variables in multiple threads at a time.
Flagging a thread
We know there’s an issue with one of these threads, so one possibility is to flag that thread:
[caption id=“attachment_2510” align=“alignnone” width=“600”]
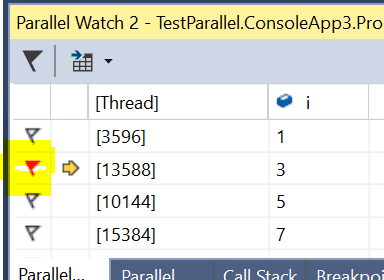 Figure 4 - Flagging a thread[/caption]
Then you can select to show only flagged threads:
[caption id=“attachment_2509” align=“alignnone” width=“600”]
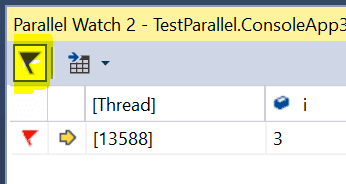 Figure 5 - Filter flagged threads[/caption]
Freezing non-relevant threads
The flags help to only trace the threads that you care about, but if you want to only run the threads that you care about, you can freeze the other threads:
[caption id=“attachment_2508” align=“alignnone” width=“508”]
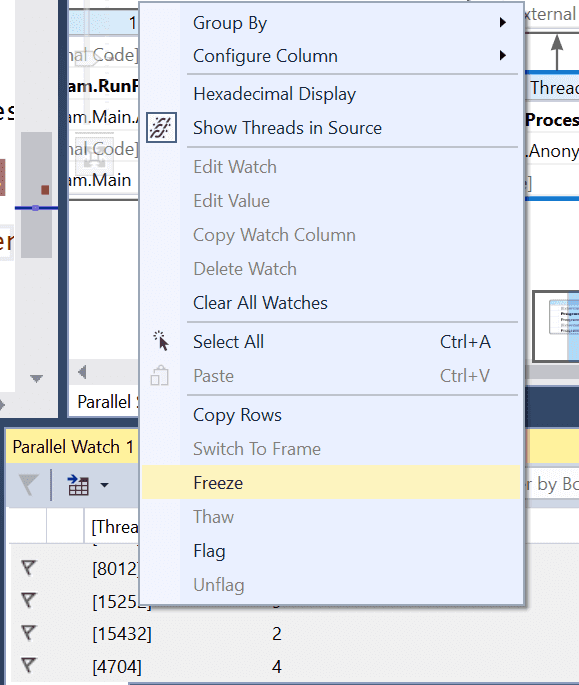 Figure 6 - Freeze Thread[/caption]
Once you’ve frozen a thread, a small pause icon appears, and that thread will stop:
[caption id=“attachment_2507” align=“alignnone” width=“600”]
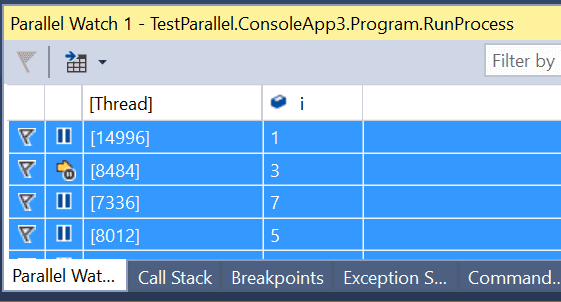 Figure 7 - Frozen Thread[/caption]
In order to freeze other threads, simply highlight all the relevant threads (Ctrl-A) and select Freeze.
It’s worth remembering that you can’t freeze a thread that doesn’t exist yet (so your breakpoint in a Parallel.For loop might only show half the threads).
Manual thread hopping
By using freeze, you can stop the debug message from jumping between threads. You can then manually control this process by simply selecting a thread and “Switch To Frame”:
[caption id=“attachment_2506” align=“alignnone” width=“600”]
 Figure 8 - Switch to Frame[/caption]
You can switch to a frozen frame, but as soon as you try to progress, you’ll flip back to the first non-frozen frame (unless you thaw it). The consequence of this is that, it is possible to switch to a frozen frame, freeze all other frames and then press F10 - you’re program will then stop dead.
Stack Trace
In a single threaded application (and in a multi-threaded application), you can always view the stack trace of a given line of executing code. There is also a Parallel Stack trace:
[caption id=“attachment_2505” align=“alignnone” width=“300”]
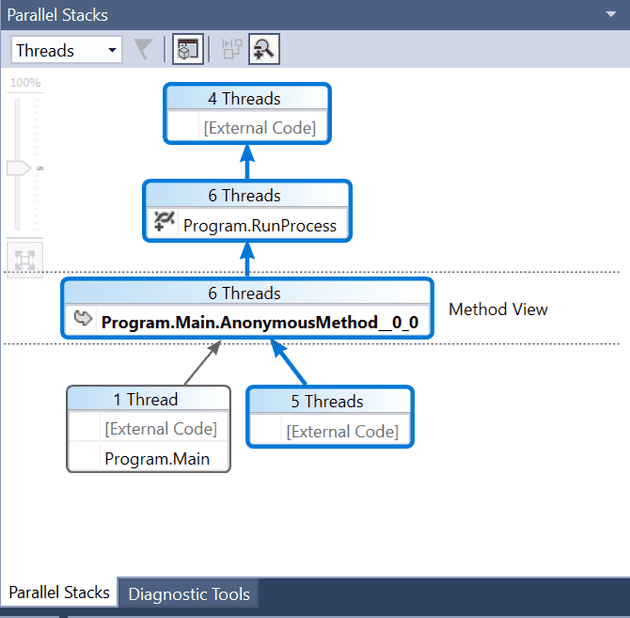 Figure 9 - Parallel Stacks[/caption]
Selecting any given method will give us the active threads, and allow switching:
[caption id=“attachment_2504” align=“alignnone” width=“600”]
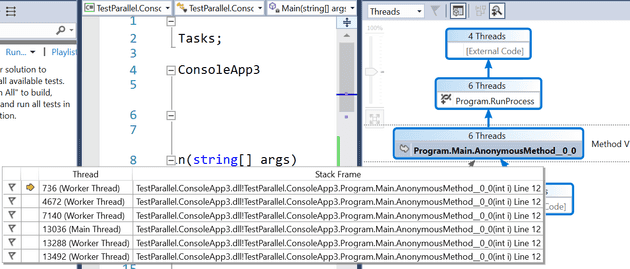 Figure 10 - Active Threads[/caption]
Parallel Stack Trace - Task View
The above view gives you a view of the created threads for your program; but most of the time, you won’t care what threads are created; only the tasks that you’ve spawned (they are not necessarily a 1 - 1 relationship. You can simply switch the view in this window to view Tasks instead:
[caption id=“attachment_2503” align=“alignnone” width=“600”]
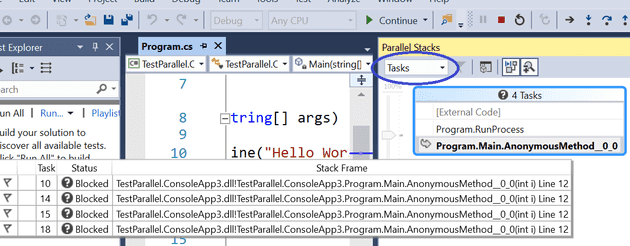 Figure 11 - Task View[/caption]
Tasks & Threads Windows
There is a tool that allows you to view all active, blocked and scheduled tasks:
[caption id=“attachment_2502” align=“alignnone” width=“600”]
 Figure 12 - Tasks Window[/caption]
This allows you to freeze an entire task, switch to a given task, and Freeze All But This:
[caption id=“attachment_2501” align=“alignnone” width=“600”]
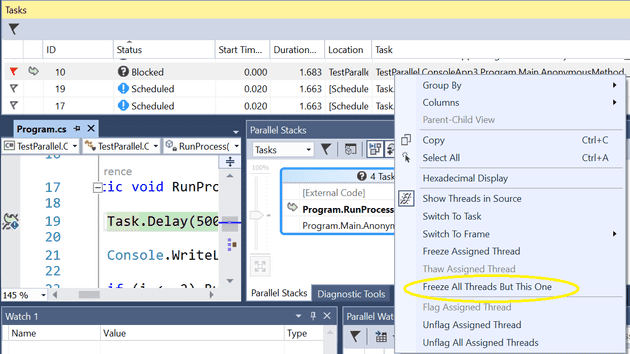 Figure 13 - Freeze All But This[/caption]
There is an equivalent window for Threads. It is broadly the same idea; however, it does have one feature that the Tasks window does not, and that it the ability to rename a thread:
[caption id=“attachment_2500” align=“alignnone” width=“600”]
 Figure 14 - Rename a Thread[/caption]
Flags
The other killer feature both of these windows have is the flag feature. Simply flag a thread, switch to it, and then select “Show Only Flagged Threads” (little flag icon). If you now remove the breakpoints, you can step through only your thread or task!
Breakpoints
So, what to do where you have a breakpoint that you might only wish to fire for a single thread? Helpfully, the breakpoints window has a filter feature:
[caption id=“attachment_2499” align=“alignnone” width=“600”]
 Figure 15 - Filter Breakpoints[/caption]
References
https://msdn.microsoft.com/en-us/library/dd554943.aspx
https://stackoverflow.com/questions/5304752/how-to-debug-a-single-thread-in-visual-studio