Application Insights provides a set of metric tools to analyse the performance and behaviour of various Azure services. For example, you can see how many calls you have to your Azure Web site, or you can see how many errors your service has generated.
This post is concerned with the scenario where you would want to manually log to application insights. The idea being that, in addition to the above metrics, you can output specific log messages in a central location. You might just want to log some debug information (“Code reached here”, “now here” - don’t try and say you’ve never been there!) Or you might find that there is a particular event in your program that you want to track, or maybe you’ve got two different resources, and you’re trying to work out how quick or frequent the communication between them is.
Set-up
The first step is to set-up a new App Insights service in the Azure Portal (you can also use the recently released Azure Portal App).
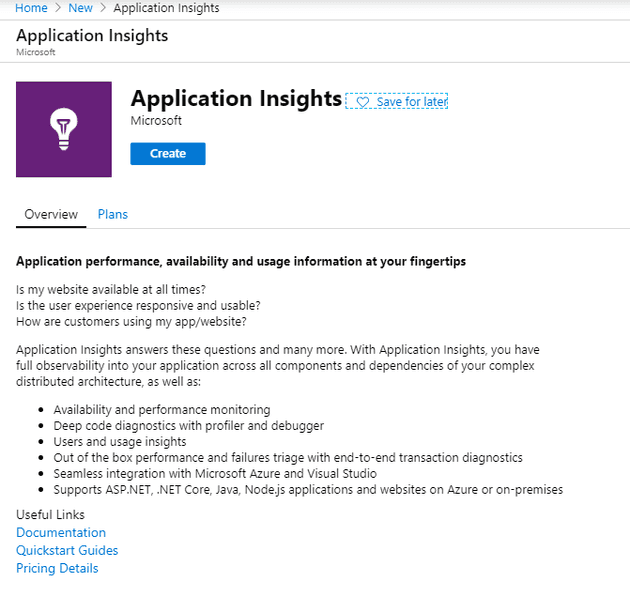
Select to create a new resource, and pick Application Insights:
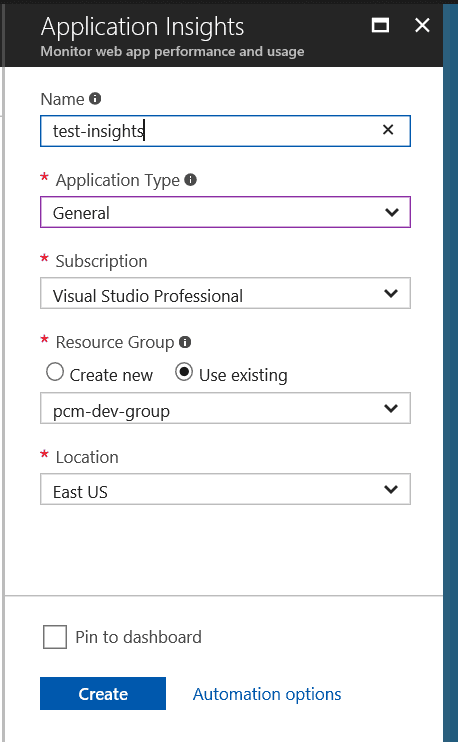
When you create the resource, you’ll be asked for some basic details (try to keep the location in the same region as the app(s) you’ll be monitoring):
The instrumentation key is shown in the overview, and you will need this later:
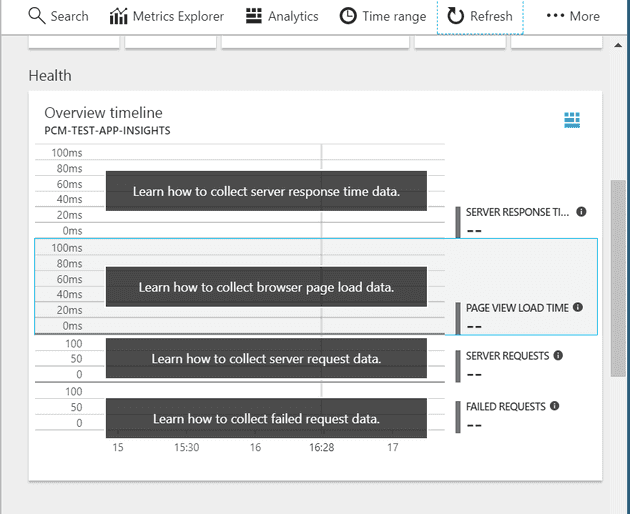
You should be able to see things like failed requests, response time, etc. However, we’ve just configured this, so it’ll be quiet for now:
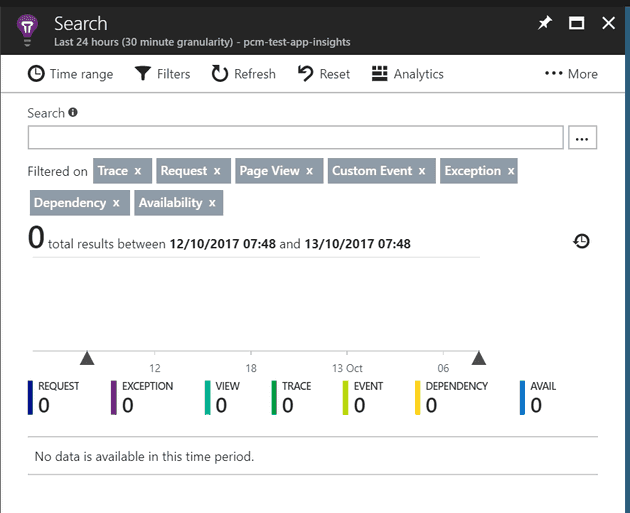
Check the “Search” window (which is where log entries will appear):
The other place you can see the output is “Logs (Analytics)“.
Create Web Job
The next thing we need is something to trace; let’s go back to a web job.
Once you’ve set-up your web job, app AppInsights from NuGet:
Install-Package ApplicationInsights.Helpers.WebJobs
The class that we’re principally interested here is the TelemetryClient. You’ll need to instantiate this class; there’s two ways to do this:
var config = Microsoft.ApplicationInsights.Extensibility.TelemetryConfiguration.CreateDefault();

var tc = new TelemetryClient(config);
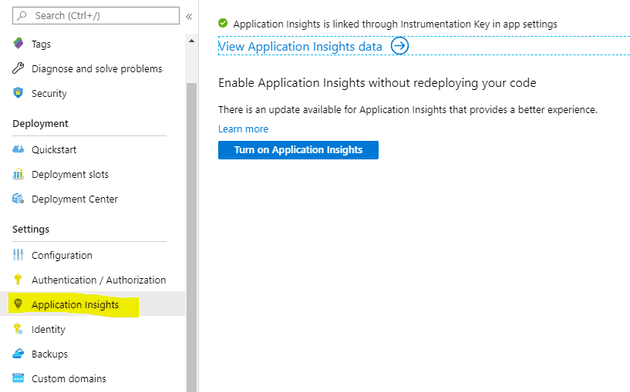
This works if you link the App Insights to the resource that you’re tracking in Azure; you’ll usually to that here:
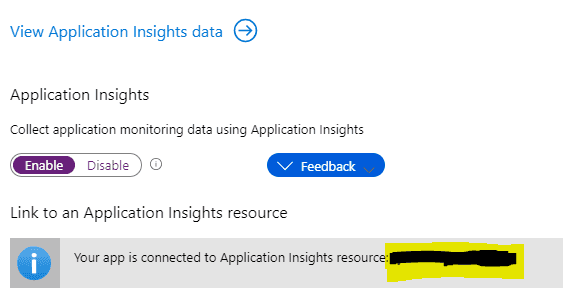
Once you’ve switched it on, you can link your resource; for example:
The other way to link them, without telling Azure that they are linked, is this:
TelemetryConfiguration.Active.InstrumentationKey = InstrumentationKey;
(You can use the instrumentation key that you noted earlier.)
Tracing
Now you’ve configured the telemetry client, let’s say you want to track an exception:
    var ai = new TelemetryClient(config);
    ai.TrackException(exception, properties);
Or you just want to trace something happening:
    var ai = new TelemetryClient(config);
    ai.TrackTrace(text);
Side note
The following code will result in a warning, telling you that it’s deprecated:
    var ai = new TelemetryClient();
    ai.TrackTrace(text);
References
http://pmichaels.net/2017/08/13/creating-basic-azure-web-job/
https://docs.microsoft.com/en-us/azure/application-insights/app-insights-cloudservices
https://docs.microsoft.com/en-us/azure/application-insights/app-insights-windows-desktop
