In this post, I’m going to cover some slightly lesser known features of App Insights: Funnels, User Flows, and Workbooks.
Funnels
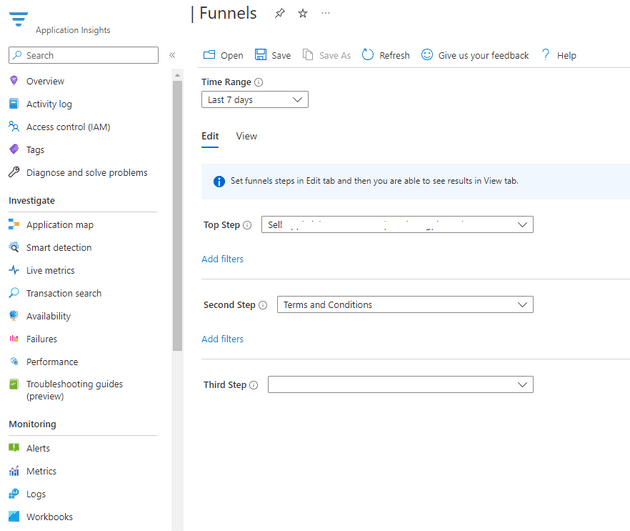
Using this feature, you can monitor a user’s journey through the events in your site or application. If you log page views, then you can use that, but you can also list events. Here’s an example of just such a journey:
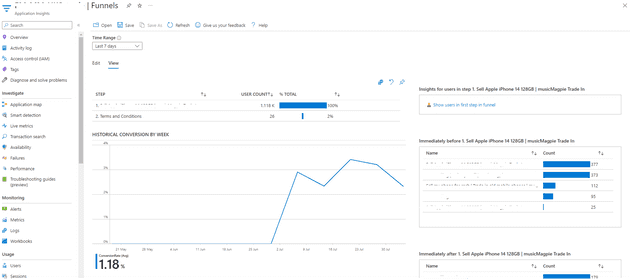
You can now view this (select the View tab):
As you can see, you now have a map of the number of people for which the first event or page view happens, then, of that number, the amount that go onto the next.
User Flows
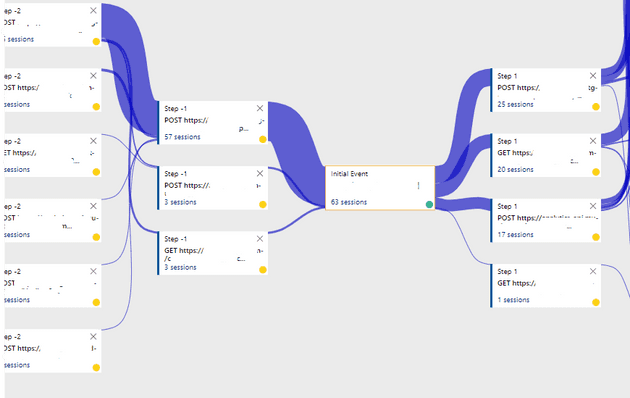
User flows are a similar idea; however, they create a spider graph, with a given event in the middle. You can view the events that led up to a given event, and those that led from it. It also gives you an indication of how much that particular path is used.
This can also be used to diagnose exceptions; you can simply select the exception that’s occurring and see what came before that exception. Similarly, if you’re calling an API or something, the call will show as a dependency, and you can see what led to that call.
Workbooks
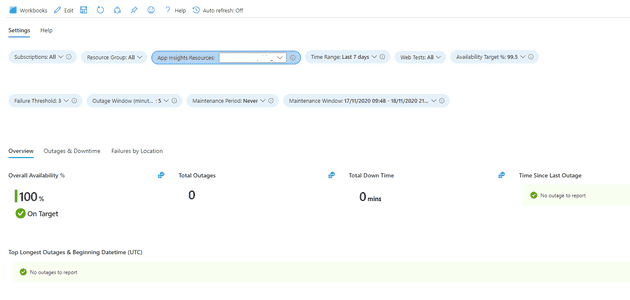
Workbooks allow you to group metrics and queries in a single place. They operate a little like a dashboard. Here’s the availability (pre-made) workbook:
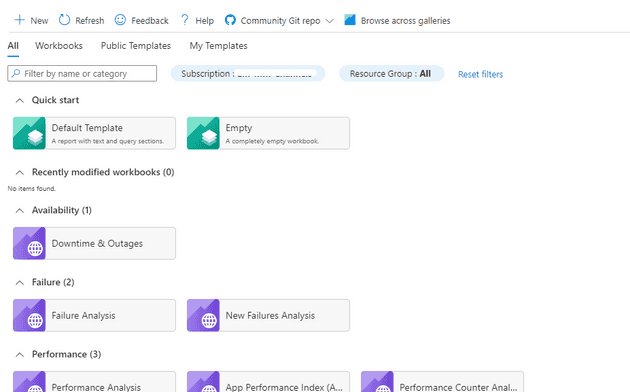
But you can easily make your own. On the main Workbook page, you can select to create an empty or templated workbook:
The Default Template just gives you a query out of the box to get you started, which may not be as useful; however, the empty one allows you to have metrics, queries, and other things. You can add things such as parameters, making the parts of the workbook interdependent.
As a very simple example of this, I can configure a simple metric that only shows where a dropdown value is set to a specific setting:
Configuring this is actually fairly straightforward. I won’t cover adding the actual metric, as you can pretty much just point and click there, but once you click Add -> Parameter, you’re presented with this form:
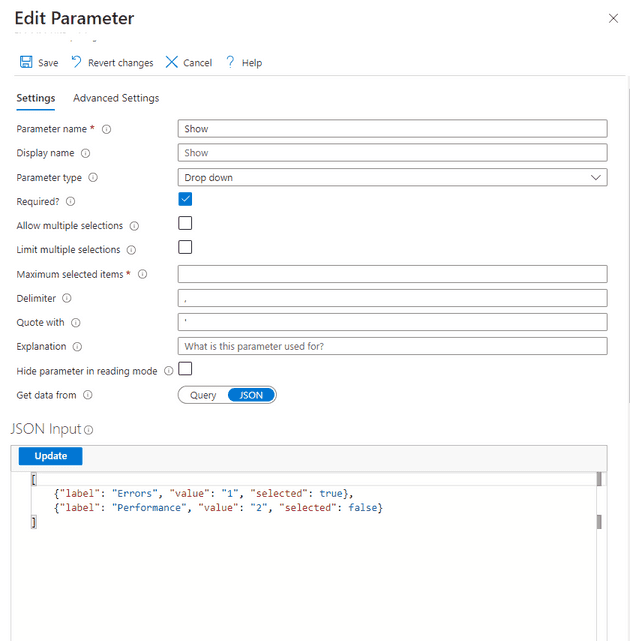
Somewhat counter intuitively, you click Add Parameter from this screen. Here’s how I filled out mine:
Most of this is pretty obvious, although the format for the dropdown is not:
[
    {"label": "Errors", "value": "1", "selected": true},
    {"label": "Performance", "value": "2", "selected": false}
]
These parameters can be interdependent, too. In fact, the parameters can be the result of queries themselves.
