In this post, I’ll cover setting up an alert, the types of alerts that can be configured, and some strategies around what it makes sense to alert on.
Basic Alerts
Azure Application Insights allows you to set-up an alert for a given state. That is, for a given metric, you can fire an alert and notify someone, or something, or even do something.
There are four concepts that are relevant for alerts: Alerts, Alert Rules, Alert Processing Rules, and Action Groups.
Alerts
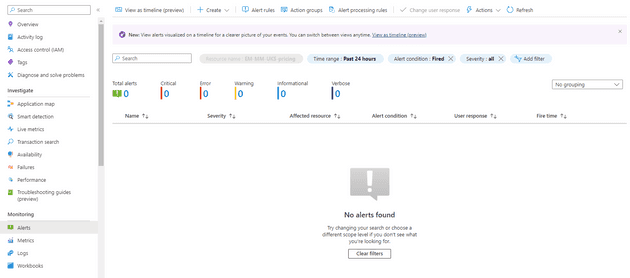
The Alerts blade is the home page for the whole alerts system:
This will show any alerts that have executed, their severity, and when they fired. You can also drill into this to find out why a given alert fired.
Alert Rules
The Alert Rules gives you a list of configured rules, along with the condition under which they will fire, and their severity:
In this blade, you can change the rules themselves; for example, you can configure a rule to respond to an increased exception rate. We’ll come back to thresholds and actual rule set-up later.
Alert Processing Rules
This allows you to schedule a rule to apply at a specific time; for example, between 12:00 - 15:00, or to execute the rule, but not invoke the action group.
Action Groups
Action Groups allow you to define what the alerts do. When an action group is created, you define two things: a notification and an action. Both are optional - you can simply have it e-mail someone to say there’s an issue; or you can have it start a runbook, call a webhook, or even execute a logic app.
Thresholds
Now that we’ve seen an overview of alerts, what they are, and what they can do, let’s drill into some specific parts. We’ll start with thresholds. Typically, when an alert fires, it fires because a threshold is reached. An example might be the number of exceptions reaches a given level.
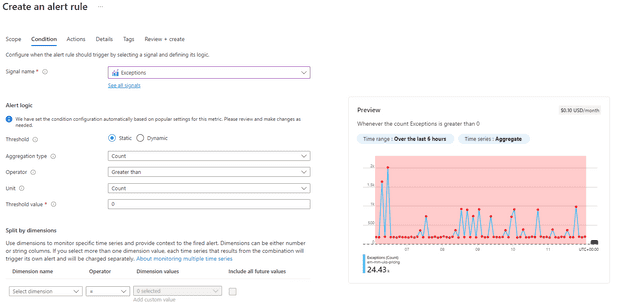
Here’s an example of such an alert being set-up:
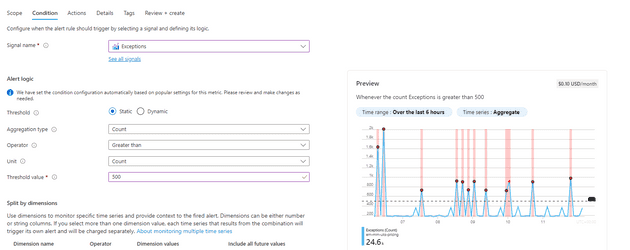
You can see that the threshold here is 0 - this means that the alert will fire for any exceptions at all. You can see that the entire area is shaded, meaning that, for the past 6 hours, the alert would have fired many times. We can change that threshold, and see that less alerts would fire:
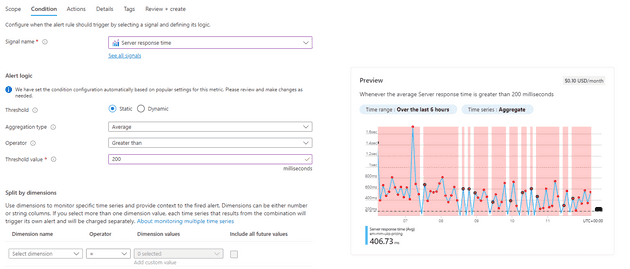
This works well in some cases - you might want to be alerted if there are any exceptions, or you might want to know when the server response time is greater than 200ms:
What would be even better for these two metrics would be if you could have the system work out what normal exceptions or response times were, and then have it alert where the relevant metric was not normal.
Dynamic vs Static Alerting
Dynamic alerts give you a way to alert based on the specific metric deviating from the standard (using standard deviation: Failure Diagnostics).
Dynamic alerts have three settings: high (sensitive), medium, and low (the least sensitive). Let’s imagine that you have a dynamic alert on exceptions: the alert fires because you suddenly go from an average of 10 exceptions per hour to 1,000 exceptions per hour. If the exceptions now stay at 1,000 you shouldn’t continue to receive alerts, as the mean will adjust, and the new high is normal; if it drops and then goes back, then you’ll get another alert, similarly if the count keeps rising, the alerts will keep coming!
Metrics
In this post I wrote about how you can add custom metrics to App Insights. What I didn’t cover there was that you can alert on this, but you can. This is particularly useful for situations where you want to alert based on a business driven metric, rather than a system driven one. For example, imagine that your business takes an average of 1,000 orders a day: you can set up an alert to flag where the number of orders drops below a given fixed point for the hour (say 10), or dynamically track the level and fire when it goes lower than is normal.
Summary
In this post, we’ve looked at Azure Application Insights Alerts. We’ve spoken about how to set them up, what the different facets are, and possible use cases for them.


