I’ve recently been playing with Event Counters in .Net. These are basically a way to record a set of metrics against a given program. In this post, I’ll cover how you can set these up and run them locally. In a later post, I’ll cover how you can do this in App Insights for a deployed app.
Initial Set-up
To run these locally, you’ll need to start by installing the dotnet tool for the counters:
dotnet tool install --global dotnet-counters --version 7.0.430602Once you’ve installed this, you can have a look at the counters that are already running (you probably will have some):
dotnet counters psWrite Some Code
Now that you’ve installed and seen dotnet counters, let’s create some code and watch our own code run. The first step is to just create a completely blank console app, then add a loop; for example:
for (int i = 1; i <= 1000; i++)
{
    await Task.Delay(500);
}
Running Locally
If you now run:
dotnet counters psYou should be able to connect to this process:
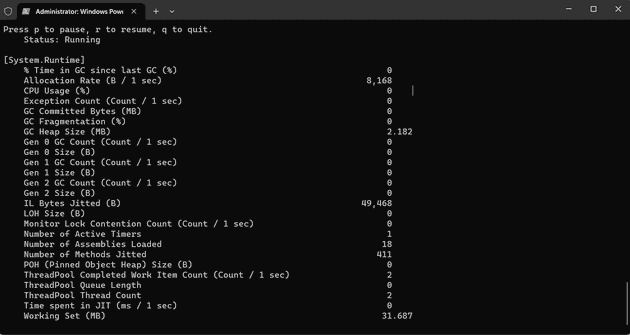
dotnet counters monitor -p 24596And you’ll see something like this:
These are just a list of stats that you can get out of the box. They will show for any .Net application - you don’t have to do anything, they’re just there already.
Let’s add our own.
Custom Counters
In the project, we’ll need a new class:
[EventSource(Name = "Aardvark")]
internal class EventSourceTest : EventSource
{
    EventCounter _eventCounter;

    public EventSourceTest()
    {
        _eventCounter = new EventCounter("test", this);
    }

    public void WriteSomeEvent()
    {
        string trace = $"test {Guid.NewGuid()}";
        _eventCounter?.WriteMetric(Random.Shared.Next(100));
        Console.WriteLine(trace);
    }
}
Whilst this class may not be doing anything actually useful, we can see that it writes a random number out - that’s our metric. The other thing to note is the name on the EventSource decorator.
In the main code, we can use this:
var eventSourceTest = new EventSourceTest();

for (int i = 1; i <= 1000; i++)
{
    await Task.Delay(500);
    eventSourceTest.WriteSomeEvent();
}
Okay, now, if you run that, you won’t really notice any difference, nor will you notice any difference if you connect (as described above); however, if you connect to the event source specifically, you should start to see that new metric tracked:
dotnet counters monitor -p 13696 AardvarkThe name relates to the event source name above; and this should start to record the custom metric:


