If you want to analyse App Insights logs then it’s very easy to do via the UI. You can click around and get some really interesting stats and information. I recently blogged about some of the cool, but lesser known, features of this. However, you can go further, and a SQL-like language is available to trawl through the logs. It’s called Kusto Query Language (KQL).
In this post, I’ll walk through a little snapshot of the language and some useful queries.
Discovery and Set-up
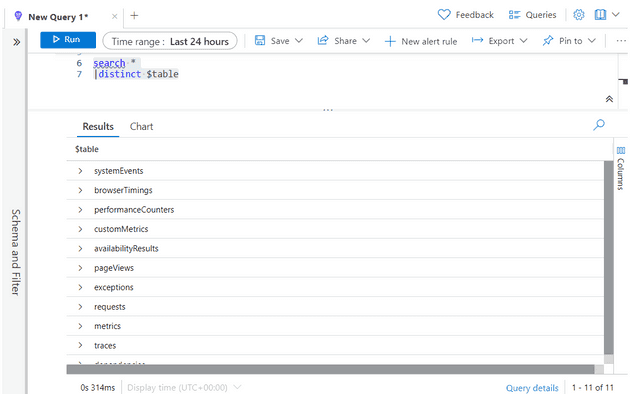
The first step is to open the App-Insights blade and navigate to Logs. This presents you with a query editor, and you can play about with the queries. The way that KQL works is that you start the query with the table that you’re querying. So the first step is to find out what tables we have:
search *
| distinct $table
This will return a list similar to the following:
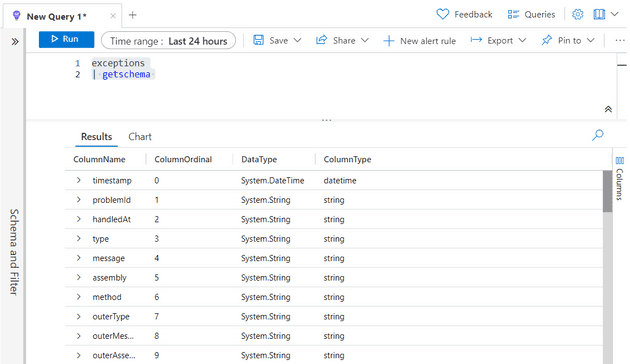
Now we’ve got a list of tables, we’ll start with exceptions, as it’s one of the most interesting. This next part was far from obvious, but we can see what fields are in the table:
exceptions
| getschema
Which returns a list of fields:
Now we have everything we need to start playing around.
Useful Queries
Let’s start playing with the options - if you just type:
exceptions
|
You’ll get some intellisense about what’s on offer - let’s start with top-hitters (that’s not a joke, that’s actually what the command is called):
exceptions
| top-hitters 10 of assembly
This will give you a breakdown of exceptions (the top 10) by the assembly from which they originated. If you have a web-site, that’s probably not that useful - but this might be:
exceptions
| top-hitters 100 of client_Browser
You can look at the availability results - obviously you can test for issues, but that doesn’t really give you anything that you can’t see in the availability pane. However, this might be more useful:
availabilityResults
| where duration > 500
| order by duration desc
Succeed or fail, that will give you the availability tests that took the longest. Looking at the requests object, we can, for example, get a list of requests where the call took a long time, but also where there were a lot of calls:
requests
| where duration > 500
| extend weightedScore = itemCount * duration
| order by weightedScore desc
This will give you a list of calls that took a long time, but that are used frequently.
extendgives you a way to include a calculated column in your query.
You can also display the information differently; for example, you can view the requests that happen the most frequently in a pie chart:
requests
| project itemCount, name
| render piechart
Or the same data as a bar chart
requests
| project itemCount, name
| render columnchart
(You can also use barchart, but that pivots the graph)

